Data Science Trends of the Future 2022

Photo credit: Unsplash. Data Science is an exciting field for knowledge workers because it increasingly intersects with the future of how industries, society, governance and policy will function. While it’s one of those vague terms thrown around a lot for students, it’s actually fairly simple to define. Data science is an interdisciplinary field that uses scientific methods, processes, algorithms and systems to extract knowledge and insights from structured and unstructured data, and apply knowledge and actionable insights from data across […]

Read more

S2, A next generation data science toolbox

  We have created a language that is faster than python in every way, works with the entire Java ecosystem (such as the Spring framework, Eclipse and many more) and can be deployed into embedded devices seamlessly, allowing you to collect and process data from pretty much any device you want even without internet. Our language comes built-in with mathematical libraries necessary for any data scientist, from basic math like Linear Algebra and Statistics to Digital Signal Processing and Time […]

Read more

When is programming needed in most leading Self Service configurations

To all Data Analysts big and small: Many Corporates typically have Self service BI and DWH solutions ( I am asking only about those who did NOT build an inhouse solution) :  -When is programming needed in most leading Self Service configurations? -When do analysts and Business executives require coding and programming when the Self service application, slice and dice, filtering and fields are not enough?! – IN SOME PLACES, us junior analysts are getting a feeling (that may be […]

Read more

Python Data Tools

Python is an increasingly popular object-oriented, interpreted and interactive programming language used for heavy-duty data analysis. Python is designed for ease-of-use, speed, readability and tailored for data-intensive applications. Python supports multiple programming paradigms, including object-oriented, imperative and functional programming styles. It features a fully dynamic type system and automatic memory management, similar to that of Scheme, Ruby, Perl and Tcl.  You can create customized data tools using Python that can handle large data sets efficiently – it lets you work more quickly and […]

Read more

An indispensable Python : Data sourcing to Data science.

Data analysis echo system has grown all the way from SQL’s to NoSQL and from Excel analysis to Visualization. Today, we are in scarceness of the resources to process ALL (You better understand what i mean by ALL) kind of data that is coming to enterprise. Data goes through profiling, formatting, munging or cleansing, pruning, transformation steps to analytics and predictive modeling. Interestingly, there is no one tool proved to be an effective solution to run all these operations { Don’t forget the […]

Read more

Plotly Beta: Graphing and Analytics Platform

Hey Data Scientists, I wanted to reach out about Plot.ly, a new startup for analyzing and beautifully visualizing data. We just launched a beta. It is built for math, science, and data applications. We’d love your thoughts. Overview:  You can import data from anywhere, and analyze it in our grid with stats, fits, functions, and more. Our plotting APIs (R, Python, MATLAB, Arduino, REST, Julia, Perl) and grid make interactive, web-ready, publication-quality graphs.  We have a Python Shell, and interactive graphs […]

Read more

New in Plotly: Interactive Graphs with IPython

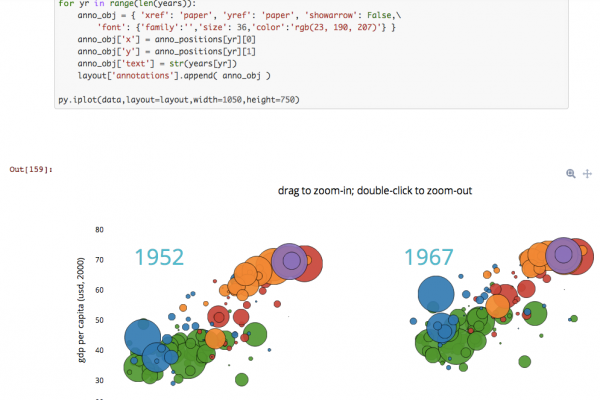
New! Plotly lets you style interactive graphs in IPython. Then, you can share your Notebook or your Plotly graph. It’s like having the NYTimes graphics department inside your IPython. You can also get these Notebooks on the Plotly GitHub page. Visit Plot.ly to see more documentation.  Here’s a preview of how it looks to have your code, data, and graph all interactively available. See the live version. To finish reading, please visit source site

Read more

Data Science In The Cloud With DataJoy

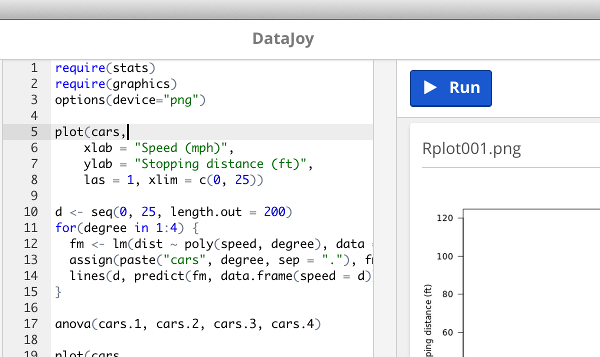
DataJoy is an unbelievably fantastic way for a working data scientist to have their favorite tools at hand. I am a minimalist when it comes to being mobile, whether working on the road, traveling for leisure, and sometimes both. I do not like to keep files on my laptop and I do not, for the most part, like to worry about keeping updated applications on my laptop. I have tried as much as possible to push my life into the […]

Read more

Machine Learning – Anomaly Detection: “Finding a Needle in a Haystack”

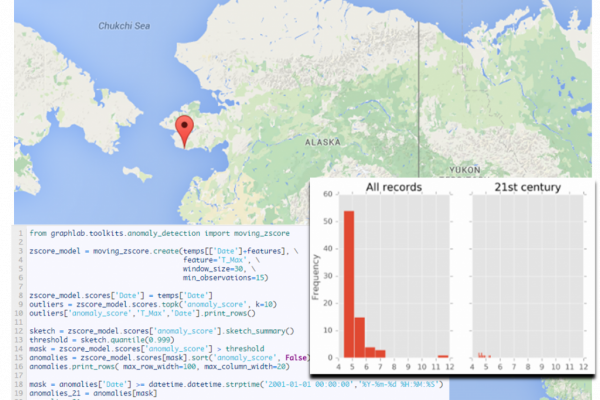
After exploring formulation, classification, benchmarking, we explore another facet of Machine Learning: anomaly detection. This part is key in the IoT transformation, as it enables internet-connected AI devices to alert, adapt and respond accordingly. Once properly trained, an IoT could not only warn and prevent imminent failure, but also execute a response, adaptive to the anomaly detected. In this process, we’ll explore intrinsic hurdles that makes the anomaly detection process a non-trivial task of “finding a needle in haystack”. Opportunities abound to explore, and any univariate sequential […]

Read more

Characteristics of Good Visual Analytics and Data Discovery Tools

Visual Analytics and Data Discovery allow analysis of big data sets to find insights and valuable information. This is much more than just classical Business Intelligence (BI). See this article for more details and motivation: “Using Visual Analytics to Make Better Decisions: the Death Pill Exa…“. Let’s take a look at important characteristics to choose the right tool for your use cases. Visual Analytics Tool Comparison and Evaluation Several tools are available on the market for Visual Analytics and Data […]

Read more
1 2