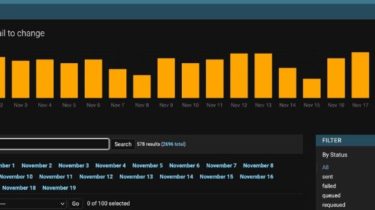
A TrueCharts automatic and bulk update utility

A easy tool for frequently used TrueNAS SCALE CLI utilities.Previously known as “trueupdate” How to install run pip install truetool Please be aware you will need to reinstall after every SCALE update How to Update run pip install –upgrade truetool How to use running truetool should be a good start. Additional options are available: Help truetool -h for the CLI help page Update truetool -u or truetool –update updates TrueNAS SCALE Apps truetool –catalog CATALOGNAME where CATALOGNAME is the name […]

Read more

Super simple bar charts for django admin list views visualizing the number of objects based on date_hierarchy using Chart.js

Super simple bar charts for django admin list views visualizing the number of objects based on date_hierarchy using Chart.js. This package serves as a ready-made drop-in solution with Chart.js included. This way you can super-charge your django admin with date-based bar charts in less than a minute 🙂 Examples Requirements Installation Install Django admin list charts from PyPI by using pip: pip install django-admin-list-charts Add ‘admin_list_charts’ entry to Django    

Read more

Charts.css.py brings charts.css to Python

charts.css.py As implied by its name, charts.css.py brings charts.css to Python. Charts.css is a pure-CSS data visualization framework. It offers advantages over traditional JS-heavy chart libraries. charts.css.py provides a pythonic API on top of charts.css, so that you can largely avoid working directly at HTML and CSS level. Installation pip install charts.css.py Usage charts.css.py process data by converting your 2-dimension number list into an HTML table, which is properly styled with CSS classes.Then you write such a string into your […]

Read more

New in Plotly: Interactive Graphs with IPython

New! Plotly lets you style interactive graphs in IPython. Then, you can share your Notebook or your Plotly graph. It’s like having the NYTimes graphics department inside your IPython. You can also get these Notebooks on the Plotly GitHub page. Visit Plot.ly to see more documentation.  Here’s a preview of how it looks to have your code, data, and graph all interactively available. See the live version. To finish reading, please visit source site

Read more