Charts.css.py brings charts.css to Python
charts.css.py
As implied by its name, charts.css.py brings charts.css to Python.
Charts.css is a pure-CSS data visualization framework. It offers advantages over traditional JS-heavy chart libraries.
charts.css.py provides a pythonic API on top of charts.css, so that you can largely avoid working directly at HTML and CSS level.
Installation
pip install charts.css.py
Usage
charts.css.py process data by converting your 2-dimension number list into an HTML table, which is properly styled with CSS classes.
Then you write such a string into your HTML page, together with,
the visual representation will be rendered by browser.
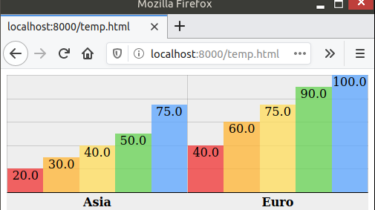
For example, the following code snippet can convert a 2-dimension list into column chart:
from charts.css import column, STYLESHEET
chart = column(
[
["Continent", "1st year", "2nd year", "3rd year", "4th year",