Maximizing Sales with Market Basket Analysis
Sales data analyses can provide a wealth of insights for any business but rarely is it made available to the public. In 2018, however, a retail chain provided Black Friday sales data on Kaggle as part of a Kaggle competition. Although the store and product lines are anonymized, the dataset presents a great learning opportunity to find business insights! In this post, we’ll cover how to prepare data, perform basic analysis, and glean additional insights via a technique called Market Basket Analysis.
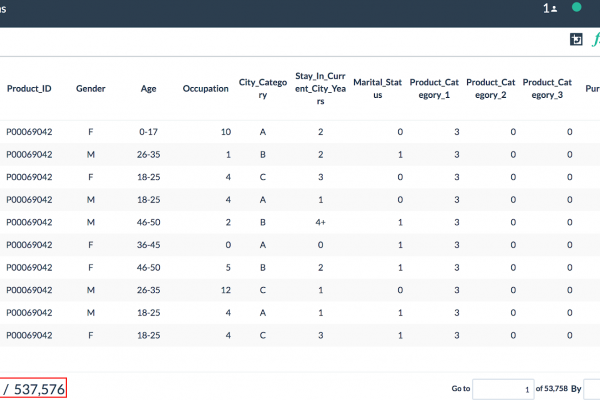
Let’s see what the data looks like. We use Pivot Billions to analyze and manipulate large amounts of data via an intuitive and familiar spreadsheet style. After importing, we see that the data contains over 500K rows at the bottom, along with example data for each column.

Visualizing the distribution of each column is easy with a simple click of the column name. Overall the data is clean, but Product_Category_2 and Product_Category_3 has many missing values (NAs). They seem like subcategories of Product_Category_1 which has no missing values. Therefore, let’s ignore them for now.