Visualizing weather changes across the world using third party APIs and Python
Weather-Forecasting
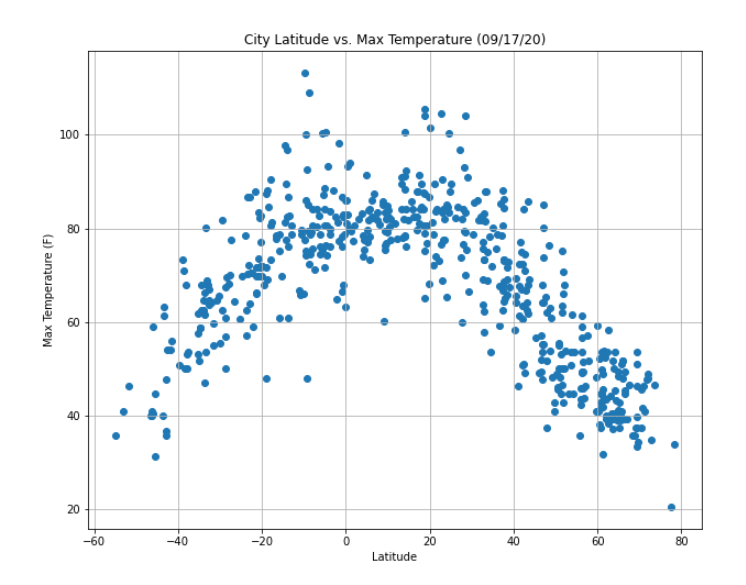
Python scripts were created to visualize the weather for over 500 cities across the world at varying distances from the equator. To understand weather patterns for forecasting, a series of scatter plots were created. The scatter plots depicted the relationship between Temperature versus Latitude, Humidity versus Latitude, Cloudiness versus Latitiude, and Wind Speed versus Latitude. One of the relationship is shown below:
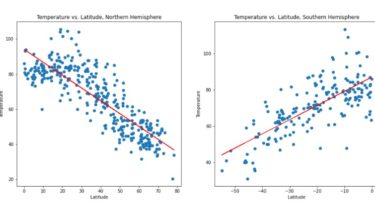
Linear regressions for each relationship were created separating them in Northern and Southern Hemispheres. More than 500 cities were randomly selected based on there latitude and longitude to perform a weather check on each of the cities usig a series of API calls to confirm the findings of the Python scripts. The analysis used external data for comparison using third