PixieDust Support of Streaming Data
With the rise of IoT devices (Internet of Things), being able to analyze and visualize live streams of data is becoming more and more important. For example, you could have sensors like thermometers in machines or portable medical devices like pacemakers, continuously streaming data to a streaming service like Kafka. PixieDust makes it easier to work with live data inside Jupyter Notebooks by providing simple integration APIs to both the PixieApp and display() framework.
On the visualization level, PixieDust uses Bokeh support for efficient data source update to plot streaming data into live charts (note that at the moment, only line chart and scatter plot are supported, but more will be added in the future). The display() framework also supports geospatial visualization of streaming data using the Mapbox rendering engine.
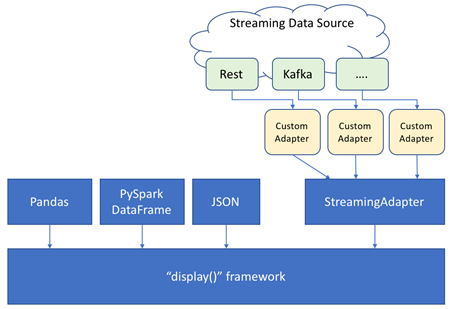
To activate streaming visualizations, you need to use a class that inherits from StreamingDataAdapter which is an abstract class that is part of the PixieDust API. This class acts as a generic bridge between the streaming data source and the visualization framework.
Note: I recommend spending time looking at the code for StreamingDataAdapter here.
The following diagram