Create matplotlib visualizations from the command-line
Create matplotlib visualizations from the command-line
MatplotCLI is a simple utility to quickly create plots from the command-line, leveraging Matplotlib.
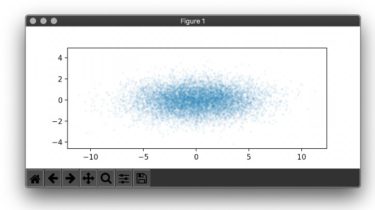
plt "scatter(x,y,5,alpha=0.05); axis('scaled')" < sample.json

plt "hist(x,30)" < sample.json

MatplotCLI accepts both JSON lines and arrays of JSON objects as input.
Look at the recipes section to learn how to handle other formats like CSV.
MatplotCLI executes python code (passed as argument) where some handy imports are already done (e.g. from matplotlib.pyplot import *) and where the input JSON data is