Create artistic visualisations with your exercise data (Python version)

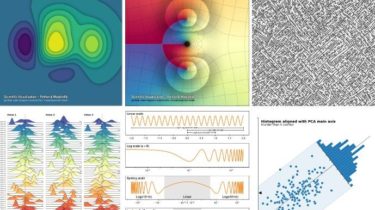
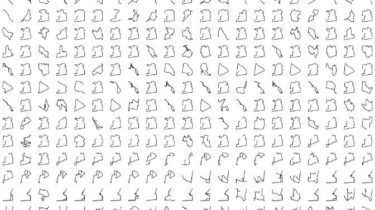
Create artistic visualisations with your exercise data (Python version). This is a port of the R strava package to Python. Examples Facets A plot of activities as small multiples. The concept behind this plot was originally inspired by Sisu. How to use Bulk export from Strava The process for downloading data is described on the Strava website here: [https://support.strava.com/hc/en-us/articles/216918437-Exporting-your-Data-and-Bulk-Export], but in essence, do the following: Log in to Strava Select “Settings” from the main drop-down menu at top right of […]

Read more

chem: collection of mostly python code for molecular visualization, QM/MM, FEP, etc

chem: collection of mostly python code for molecular visualization, QM/MM, FEP, etc. Very long-term goal is something like enzyme design. Intended for interactive use from standard python prompt. Major features: 3D visualization of molecular geometry, orbitals, ESP, etc. fast OpenGL volume and isosurface rendering oriented toward analysis and debugging of calculations rather than presentation QM/MM driver supporting electrostatic embedding with various charge shifting schemes DLC/HDLC/Redundant internal coordinates transition state search (Dimer method, Lanczos method), reaction path optimization (NEB) read/write .pdb, […]

Read more

A web-based visualization and debugging platform for NuPIC

A web-based visualization and debugging platform for NuPIC. Usage Set up cerebro2.server to export your model state. Then, run: cd static python -m SimpleHTTPServer 8000 Finally, visit the following URL in your browser: Screenshots To enable taking screenshots with the p keyboard shortcut, open js/classes/abstract_visualization.js and uncomment the line under the note about screenshots. Quicker Setup See ‘run_server.py’ for a quicker setup. GitHub View Github    

Read more

Module to visualize where your python script is slow

It provides: Code lines that impact your code speed. Visualisation of slow code lines for quick fix. Python 3.9Require matplotlib.pyplot, numpy from speed_testpy import ScriptProfilerPy ScriptProfilerPy(filepath=”example_testfile.py”).Profiler()output > code_profile_output.png ‘Make a copy of your python script to prevent any issues. ‘Executing this script with same packages as your scrpt’s virtual environment. Your script will be executed as a standard python import Provide the python script pathThe module will insert datetime() variable at each non-indented line. Your code is opened, read and […]

Read more

Python library to visualize circular plasmid maps

Plasmidviewer is a Python library to visualize plasmid maps from GenBank.This library provides only the function to visualize circular plasmids and doesn’t provide functions to edit nucleotides and sequence features.If you want to do such operations, please use QUEEN, which I have recently developed.(In fact, this library is implemented based on the visualization function of QUEEN) Installation You can install this library using the following single command:pip install git+https://github.com/ponnhide/plasmidviewer.git Example code

Read more

An open access book on scientific visualization using python and matplotlib

Scientific Visualization: Python + Matplotlib Nicolas P. Rougier, Bordeaux, November 2021. The Python scientific visualisation landscape is huge. It is composed of a myriad of tools, ranging from the most versatile and widely used down to the more specialised and confidential. Some of these tools are community based while others are developed by companies. Some are made specifically for the web, others are for the desktop only, some deal with 3D and large data, while others target flawless 2D rendering. […]

Read more

HM02: Visualizing Interesting Datasets

This is a homework assignment for CSCI 40 class at Claremont McKenna College. Go to the project page to learn more! Graph 1. Frequency of Nobel Prize Award in 15 Countries Graph 1 compares the frequency of Nobel Prizes awarded to different countries. Each country code represents a country. Among the 15 countries selected, Bavaria (DE) had nine individuals been awarded Nobel Prize. Check out other countries in this data set if you are interested! Graph 2. Number of On-time […]

Read more

A sorting visualizer made with Tkinter

This is a sorting visualizer made with Tkinter. Make sure you’ve installed tkinter in your system to use this visualizer To install tkinter using python package manager, run the following: pip install tk Or follow the below website https://www.tutorialspoint.com/how-to-install-tkinter-in-python The visualizer has: Merge Sort Selection Sort Bubble Sort Insertion Sort Various colours are used to make the visualizer easily understandable. Updates are highly appreciatable GitHub View Github    

Read more

Like ThreeJS but for Python and based on wgpu

pygfx A render engine, inspired by ThreeJS, but for Python and targeting Vulkan/Metal/DX12 (via wgpu). Introduction This is a Python render engine build on top of WGPU (instead of OpenGL). We take a lot of inspiration from ThreeJS, e.g.: Materials and Geometry are combined in world objects. No event system, but controls that make it relatively easy to integrate with one. Decoupled cameras and controls. The code for the render engines is decoupled from the objects, allowing multiple render engines […]

Read more
1 2 3