An open access book on scientific visualization using python and matplotlib
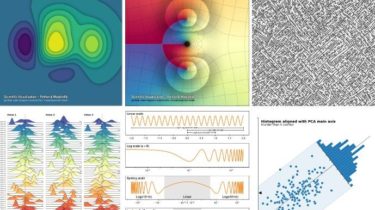
Scientific Visualization: Python + Matplotlib
Nicolas P. Rougier, Bordeaux, November 2021.

The Python scientific visualisation landscape is huge. It is composed of a myriad of tools, ranging from the most versatile and widely used down to the more specialised and confidential. Some of these tools are community based while others are developed by companies. Some are made specifically for the web, others are for the desktop only, some deal with 3D and large data, while others target flawless 2D rendering. In this landscape, Matplotlib has a very special place. It is a versatile and powerful library that allows you to design very high quality figures, suitable for scientific publishing. It also offers