Visually Explained: Three Excel Core-Features Even Excel-Pros Don’t Know
Over the last few years, Excel has been redesigned from the ground up. Currently, Microsoft is making the new Excel core-features available to every user, regardless of your Office 365 license. Thanks to the Microsoft naming conventions, it is easy to confuse the new features with existing ones. That being said, Power Query and Power Pivot are not the same things as Pivot Tables, which you have likely been using for years.
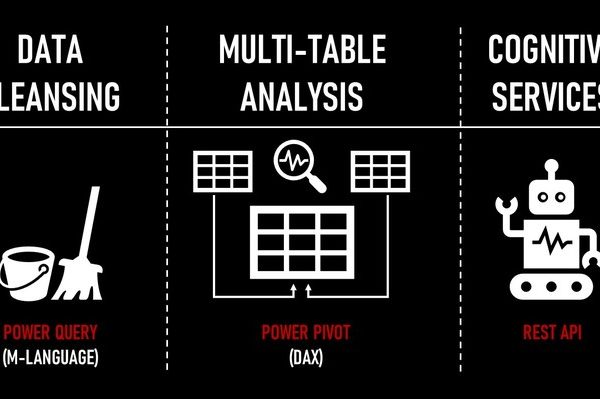
Power Query (M-Language)
Data preparation is very time-consuming. Power Query allows you to cleanse large amounts of data and make them usable within Excel: for example, a large CSV log file with lots of missing values, weird formats, and errors. Power Query is UI based, it’s easy to learn, and if you want to go the extra mile, you can learn its M-Language, which enables you to write custom scripts to automate data cleansing.
Power Pivot (DAX)
With Power Pivot, you can structure multiple tables into a star schema, with lookup tables and data tables. DAX (Data Analysis Expression) is a language that enables you to analyze data across your entire model. The learning curve is a bit steep, as you need