Visualize tensors in a plain Python REPL using Sparklines
sparkvis
This is a library for visualizing tensors in a plain Python REPL using sparklines. I was sick of having to install jupyter on servers just to see a damn tensor.
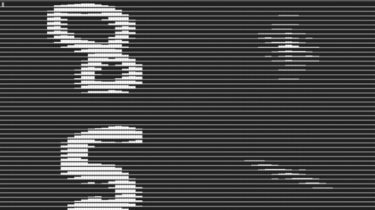
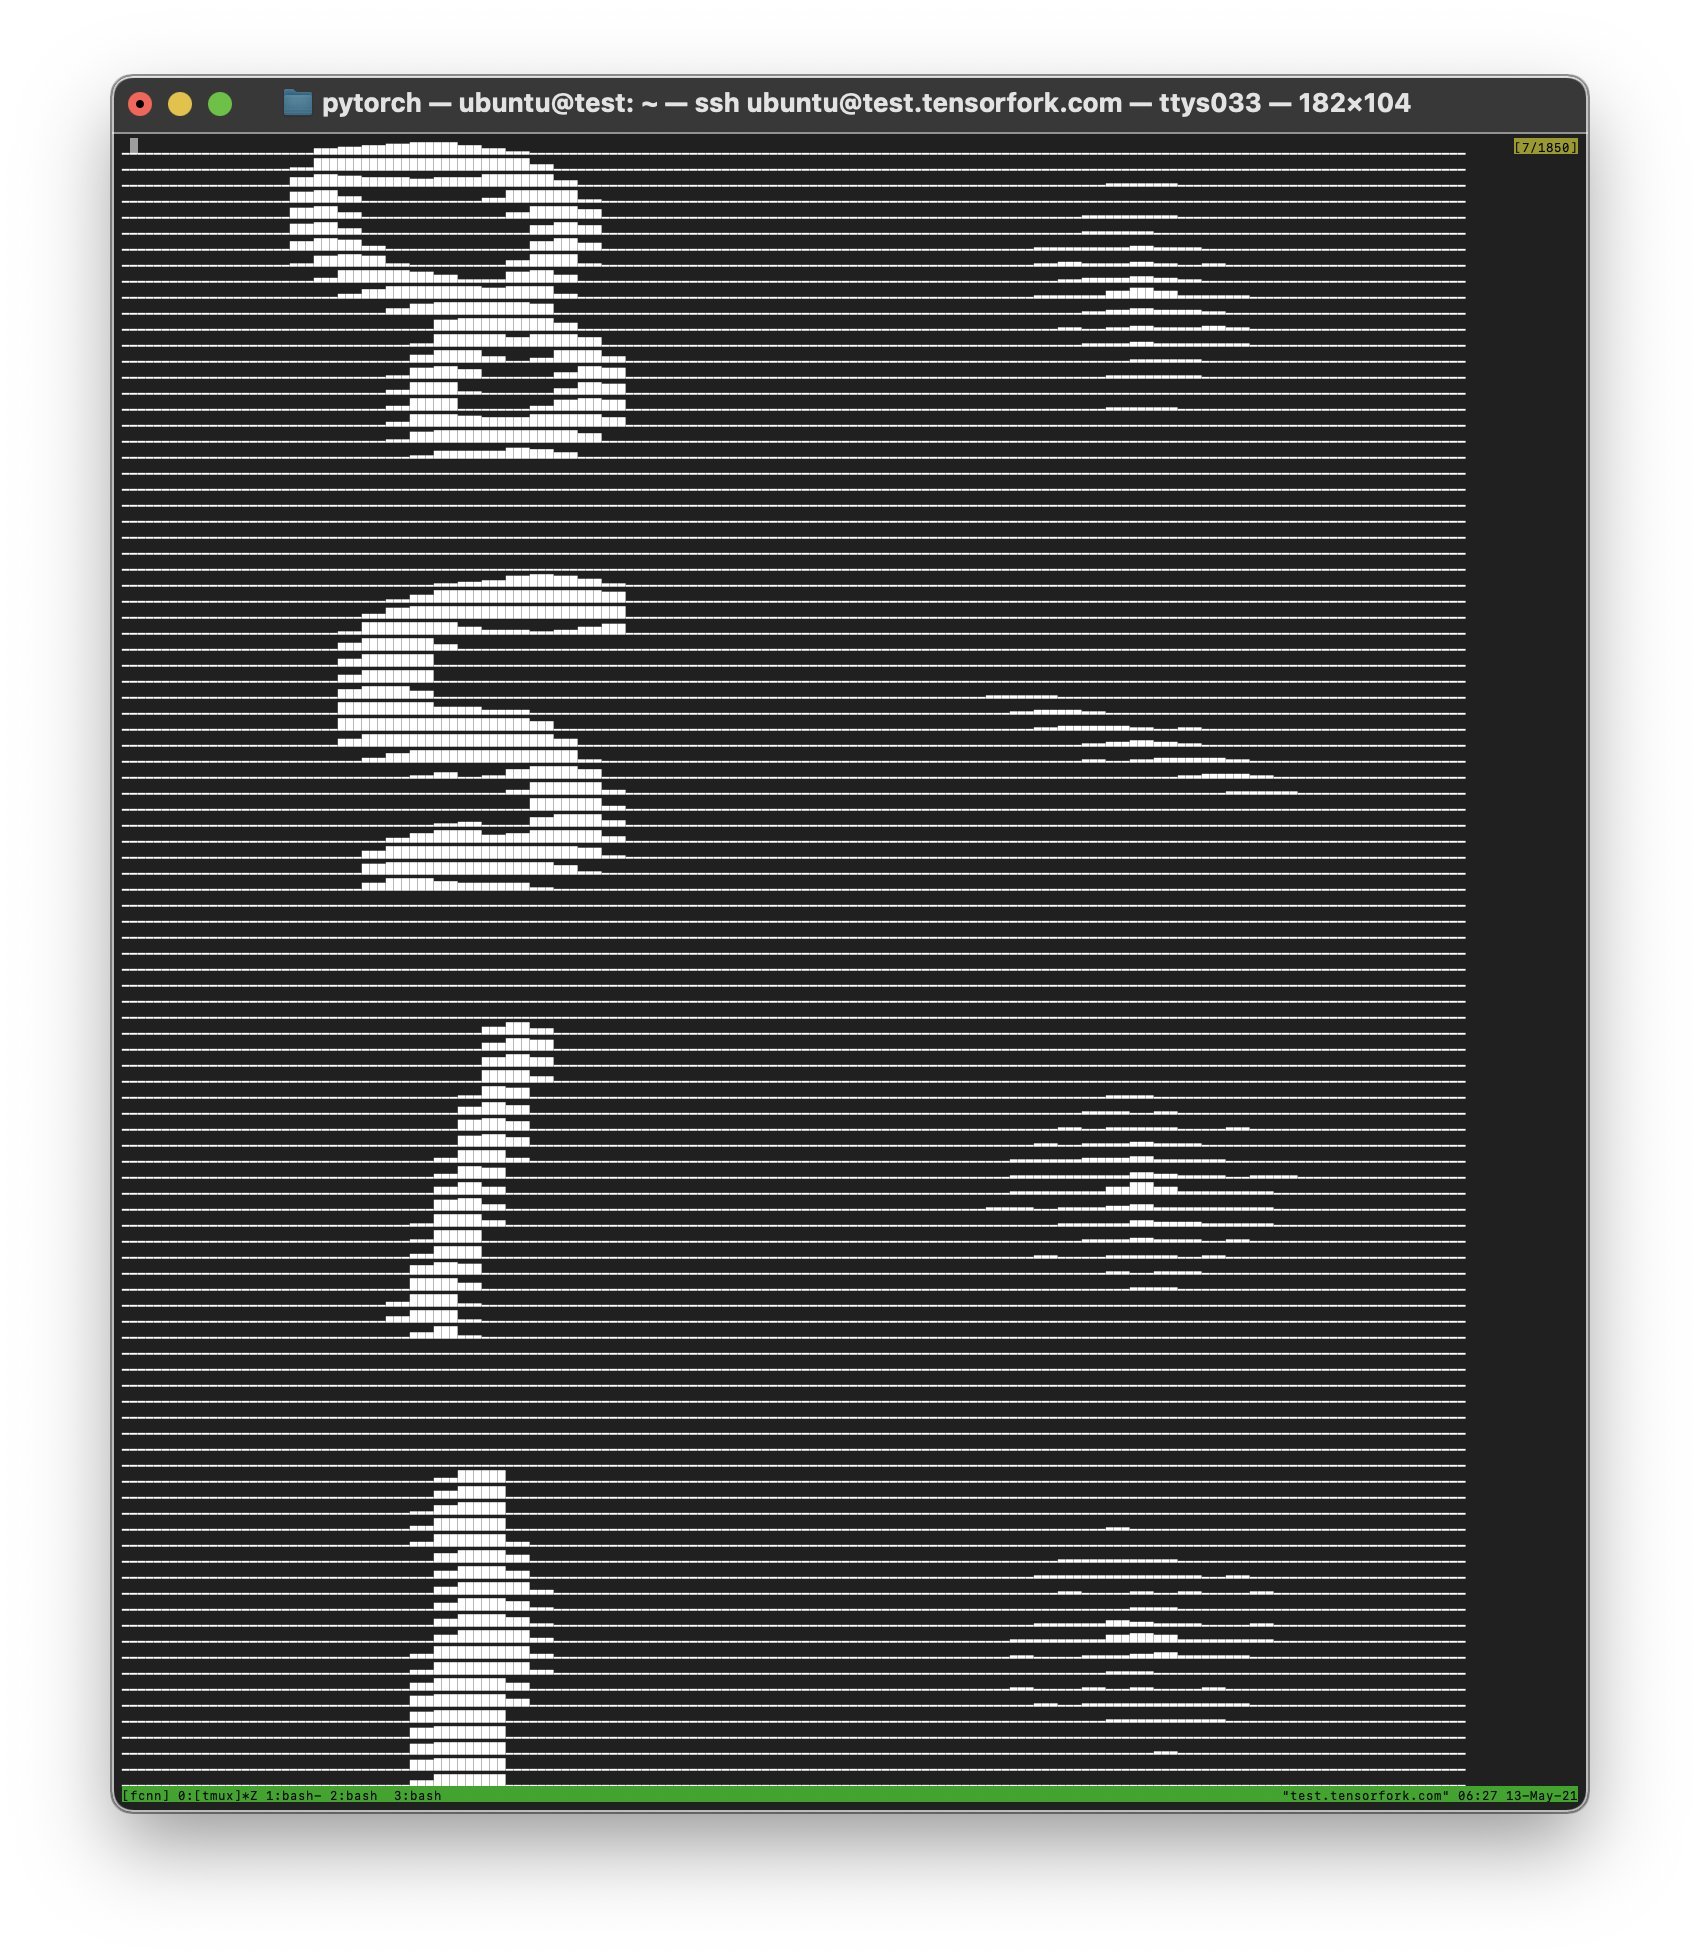
E.g. the FFT of MNIST looks like this:
Quickstart
pip3 install -U sparkvis
python3
from sparkvis import sparkvis as vis
vis(foo)
foo can be a torch tensor, tf tensor, numpy array, etc. It supports anything with a .numpy() method.
vis(a, b) will put ‘a’ and ‘b’ side by side. For example,
import numpy as np
from sparkvis import sparkvis as vis
x = np.random.rand(7,7)
vis(x, np.zeros_like(x), np.ones_like(x))
will print this:
▅▅▅▄▄▄▂▂▂▅▅▅▄▄▄▅▅▅▅▅▅▁▁▁▁▁▁▁▁▁▁▁▁▁▁▁▁▁▁▁▁▁█████████████████████
▄▄▄▃▃▃▃▃▃▆▆▆▁▁▁▃▃▃███▁▁▁▁▁▁▁▁▁▁▁▁▁▁▁▁▁▁▁▁▁█████████████████████
▆▆▆▇▇▇▆▆▆▂▂▂▇▇▇▅▅▅▂▂▂▁▁▁▁▁▁▁▁▁▁▁▁▁▁▁▁▁▁▁▁▁█████████████████████
███▇▇▇▃▃▃▇▇▇▄▄▄▂▂▂▂▂▂▁▁▁▁▁▁▁▁▁▁▁▁▁▁▁▁▁▁▁▁▁█████████████████████
▆▆▆▅▅▅▇▇▇▅▅▅███▆▆▆▄▄▄▁▁▁▁▁▁▁▁▁▁▁▁▁▁▁▁▁▁▁▁▁█████████████████████
▂▂▂▇▇▇▇▇▇▆▆▆▆▆▆▁▁▁▃▃▃▁▁▁▁▁▁▁▁▁▁▁▁▁▁▁▁▁▁▁▁▁█████████████████████
▅▅▅▇▇▇▆▆▆▅▅▅▅▅▅▁▁▁▇▇▇▁▁▁▁▁▁▁▁▁▁▁▁▁▁▁▁▁▁▁▁▁█████████████████████
7x21 min=0.0 max=1.0
You can pass