Understanding ROC Curves with Python

In the current age where Data Science / AI is booming, it is important to understand how Machine Learning is used in the industry to solve complex business problems. In order to select which Machine Learning model should be used in production, a selection metric is chosen upon which different machine learning models are scored.
One of the most commonly used metrics nowadays is AUC-ROC (Area Under Curve – Receiver Operating Characteristics) curve. ROC curves are pretty easy to understand and evaluate once there is a good understanding of confusion matrix and different kinds of errors.
In this article, I will explain the following topics:
- Introduction to confusion matrix and different statistic computed on it
- Definitions of TP, FN, TN, FP
- Type 1 and Type 2 errors
- Statistics computed from Recall, Precision, F-Score
- Introduction to AUC ROC Curve
- Different scenarios with ROC Curve and Model Selection
- Example of ROC Curve with Python
Introduction to Confusion Matrix
In order to showcase the predicted and actual class labels from the Machine Learning models, the confusion matrix is used. Let us take an example of a binary class classification problem.
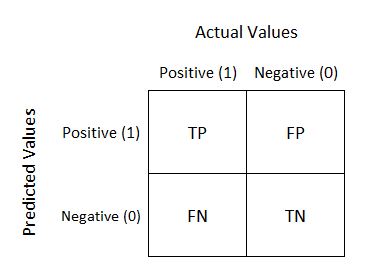
The