New in Plotly: Interactive Graphs with IPython
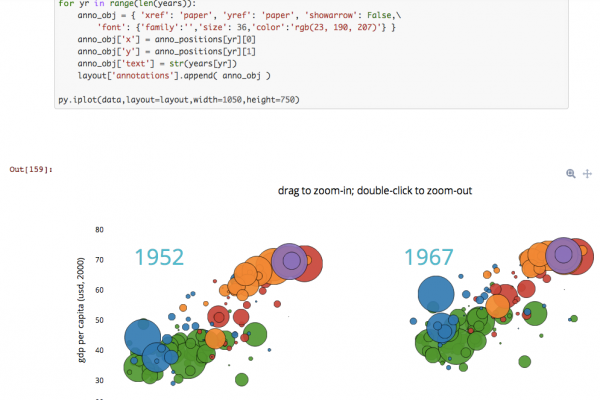
New! Plotly lets you style interactive graphs in IPython. Then, you can share your Notebook or your Plotly graph. It’s like having the NYTimes graphics department inside your IPython. You can also get these Notebooks on the Plotly GitHub page. Visit Plot.ly to see more documentation. Here’s a preview of how it looks to have your code, data, and graph all interactively available. See the live version. To finish reading, please visit source site
Read more