Rotate Axis Labels in Matplotlib

Introduction
Matplotlib is one of the most widely used data visualization libraries in Python. Much of Matplotlib’s popularity comes from its customization options – you can tweak just about any element from its hierarchy of objects.
In this tutorial, we’ll take a look at how to rotate axis text/labels in a Matplotlib plot.
Creating a Plot
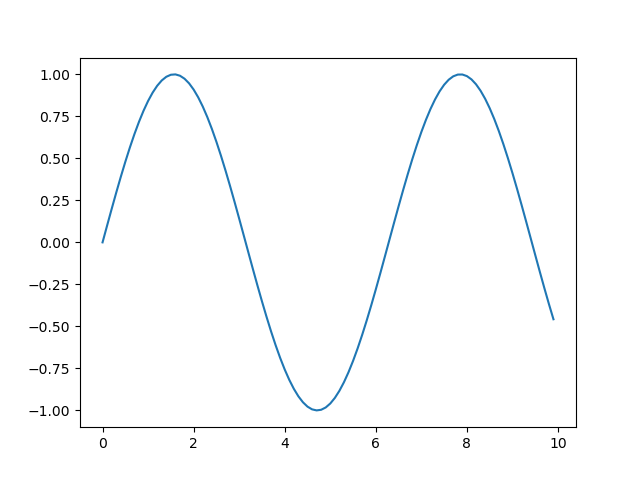
Let’s create a simple plot first:
import matplotlib.pyplot as plt
import numpy as np

x = np.arange(0, 10, 0.1)
y = np.sin(x)

plt.plot(x, y)
plt.show()

Rotate X-Axis Labels in Matplotlib
Now, let’s take a look at how we can rotate the X-Axis labels here. There are two ways to go about it – change it on the Figure-level using plt.xticks() or change it on an Axes-level by using tick.set_rotation() individually, or even by using ax.set_xticklabels() and ax.xtick_params().
Let’s start off with the first