Quickly visualize docker networks with graphviz
Docker Network Graph
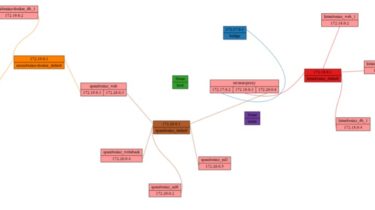
Visualize the relationship between Docker networks and containers as a neat graphviz graph.
Usage
usage: docker-net-graph.py [-h] [-v] [-o OUT]

Visualize docker networks.

optional arguments:
  -h, --help         show this help message and exit
  -v, --verbose      Verbose output
  -o OUT, --out OUT  Write output to file
In most cases what you want to run are the following couple commands:
git clone https://github.com/LeoVerto/docker-network-graph.git
cd docker-network-graph
pipenv install
pipenv run python docker-net-graph.py -o output.svg
This will generate an .svg file containing the graph.
Running inside docker
If you want to generate a graph for a remote system you can also easily
run this script inside a pre-built docker container:
docker run --rm -v /var/run/docker.sock:/var/run/docker.sock leoverto/docker-network-graph
This will just generate and output the