Plot a Decision Surface for Machine Learning Algorithms in Python
Last Updated on August 26, 2020
Classification algorithms learn how to assign class labels to examples, although their decisions can appear opaque.
A popular diagnostic for understanding the decisions made by a classification algorithm is the decision surface. This is a plot that shows how a fit machine learning algorithm predicts a coarse grid across the input feature space.
A decision surface plot is a powerful tool for understanding how a given model “sees” the prediction task and how it has decided to divide the input feature space by class label.
In this tutorial, you will discover how to plot a decision surface for a classification machine learning algorithm.
After completing this tutorial, you will know:
- Decision surface is a diagnostic tool for understanding how a classification algorithm divides up the feature space.
- How to plot a decision surface for using crisp class labels for a machine learning algorithm.
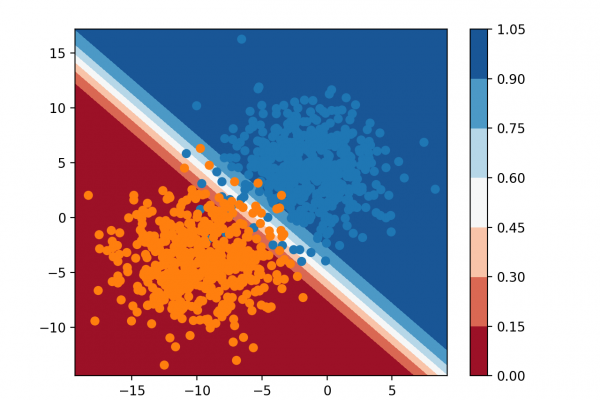
- How to plot and interpret a decision surface using predicted probabilities.
Kick-start your project with my new book Machine Learning Mastery With Python, including step-by-step tutorials and the Python source code files for all examples.
Let’s get started.
 To finish reading, please visit source site