How to Visualize Time Series Residual Forecast Errors with Python
Last Updated on September 18, 2019
Forecast errors on time series regression problems are called residuals or residual errors.
Careful exploration of residual errors on your time series prediction problem can tell you a lot about your forecast model and even suggest improvements.
In this tutorial, you will discover how to visualize residual errors from time series forecasts.
After completing this tutorial, you will know:
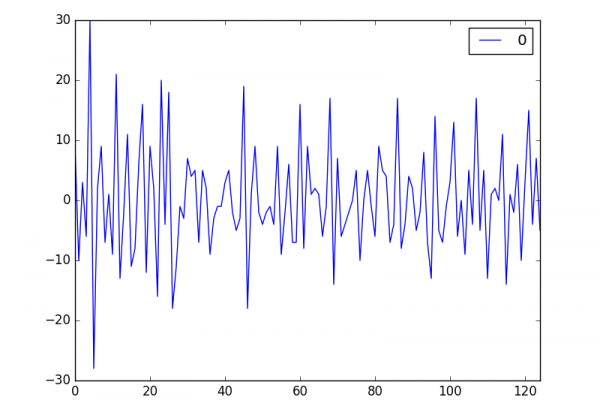
- How to create and review line plots of residual errors over time.
- How to review summary statistics and plots of the distribution of residual plots.
- How to explore the correlation structure of residual errors.
Kick-start your project with my new book Time Series Forecasting With Python, including step-by-step tutorials and the Python source code files for all examples.
Let’s get started.
- Updated Apr/2019: Updated the link to dataset.
- Updated Aug/2019: Updated data loading to use new API.
- Updated Sept/2019: Updated examples to use latest API.
Residual Forecast Errors
Forecast errors on a time series forecasting problem are called residual errors or residuals.
A residual error is calculated as the expected outcome minus the forecast, for example: