How to Load and Explore Household Electricity Usage Data
Last Updated on August 5, 2019
Given the rise of smart electricity meters and the wide adoption of electricity generation technology like solar panels, there is a wealth of electricity usage data available.
This data represents a multivariate time series of power-related variables, that in turn could be used to model and even forecast future electricity consumption.
In this tutorial, you will discover a household power consumption dataset for multi-step time series forecasting and how to better understand the raw data using exploratory analysis.
After completing this tutorial, you will know:
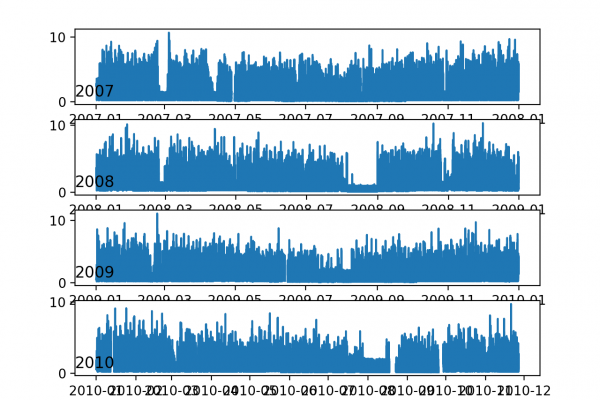
- The household power consumption dataset that describes electricity usage for a single house over four years.
- How to explore and understand the dataset using a suite of line plots for the series data and histogram for the data distributions.
- How to use the new understanding of the problem to consider different framings of the prediction problem, ways the data may be prepared, and modeling methods that may be used.
Kick-start your project with my new book Deep Learning for Time Series Forecasting, including step-by-step tutorials and the Python source code files for all examples.
Let’s get started.