How to Better Understand Your Machine Learning Data in Weka
Last Updated on August 22, 2019
It is important to take your time to learn about your data when starting on a new machine learning problem.
There are key things that you can look at to very quickly learn more about your dataset, such as descriptive statistics and data visualizations.
In this post you will discover how you can learn more about your data in the Weka machine learning workbench my reviewing descriptive statistics and visualizations of your data.
After reading this post you will know about:
- The distribution of attributes from reviewing statistical summaries.
- The distribution of attributes from reviewing univariate plots.
- The relationship between attributes from reviewing multivariate plots.
Kick-start your project with my new book Machine Learning Mastery With Weka, including step-by-step tutorials and clear screenshots for all examples.
Let’s get started
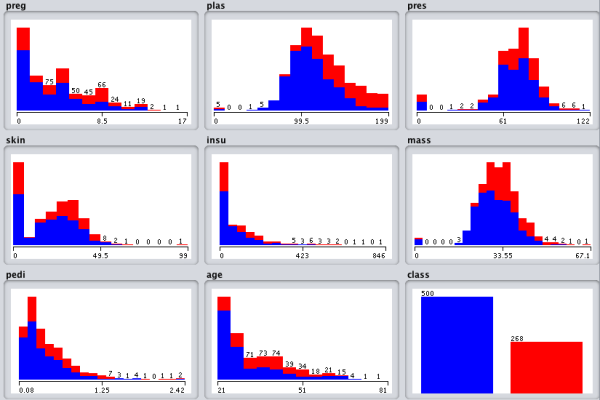
Better Understand Your Data With Descriptive Statistics
The Weka explorer will automatically calculate descriptives statistics for numerical attributes.
- Open The Weka GUI Chooser.
- Click “Explorer” to open the Weka Explorer.
- Load the Pima Indians datasets from data/diabetes.arff
The Pima Indians dataset contains numeric input variables that we can use to demonstrate the calculation of descriptive statistics.
Firstly, note that the dataset summary
To finish reading, please visit source site