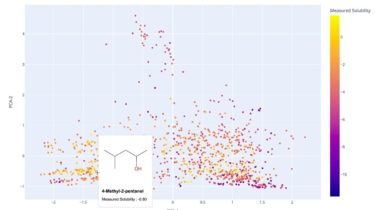
Add-on to plotly which show molecule images on mouseover

molplotly is an add-on to plotly built on RDKit which allows 2D images of molecules to be shown in plotly figures when hovering over the data points. A readable walkthrough of how to use the package together with some useful examples can be found in this blog post while a runnable notebook can be found in examples/simple_usage_and_formatting.ipynb 🙂 Installation pip install molplotly conda install rdkit Usage

Read more

Pglive package adds support for thread-safe live plotting to pyqtgraph

Pglive package adds support for thread-safe live plotting to pyqtgraph.It supports PyQt5 and PyQt6. By default, pyqtgraph doesn’t support live plotting.Aim of this package is to provide easy implementation of Line, Scatter and Bar Live plot.Every plot is connected with it’s DataConnector, which sole purpose is to consume data points and manage data re-plotting.DataConnector interface provides Pause and Resume method, update rate and maximum number of plotted points.Each time data point is collected, call DataConnector.cb_set_data or DataConnector.cb_append_data_point callback.That’s all You […]

Read more

Data on Free Food at MIT

Procrastinating research by plotting data on how long it takes emails on the free-food at mit edu mailing list to go through. Data is thanks to Gabriel R., who sent this email at 6:43 p.m., October 31, 2021 to the MIT free food mailing list along with a survey link: apparently food mailing lists can have a surprisingly long delay to send email, so i’ve decided to make this form to test out the delay. please fill it out to […]

Read more

Python Individual Conditional Expectation Plot Toolbox

Python Individual Conditional Expectation Plot Toolbox A Python implementation of individual conditional expecation plots inspired by R’s ICEbox. Individual conditional expectation plots were introduced in Peeking Inside the Black Box: Visualizing Statistical Learning with Plots of Individual Conditional Expectation (arXiv:1309.6392). Quickstart pycebox is available on PyPI and can be installed with pip install pycebox. The tutorial recreates the first example in the above paper using pycebox. Development For easy development and prototyping using IPython notebooks, a Docker environment is included. […]

Read more

Python partial dependence plot toolbox

python partial dependence plot toolbox Motivation This repository is inspired by ICEbox. The goal is to visualize the impact of certain features towards model prediction for any supervised learning algorithm. (now support all scikit-learn algorithms) The common headache When using black box machine learning algorithms like random forest and boosting, it is hard to understand the relations between predictors and model outcome. For example, in terms of random forest, all we get is the feature importance. Although we can know […]

Read more

Generating plots of Bohemian eigenvalues with python

Bohemian Eigenvalue Plotting Examples This repository contains examples of generating plots of Bohemian eigenvalues. The examples in this repository are currently only available in Python. All examples use the bohemian library. Pentadiagonal Skew Symmetric Python: python/Pentadiagonal_Skew_Symmetric_20x20.py Upper-Hessenberg Toeplitz Python: python/UHT_0_Diag_d3_16x16.py GitHub https://github.com/BohemianMatrices/bohemian-examples    

Read more

A Cross-Platform Plot Manager for Chia Plotting

Swar’s Chia Plot Manager This is a Cross-Platform Plot Manager for Chia Plotting that is simple, easy-to-use, and reliable. Features Stagger your plots so that your computer resources can avoid high peaks. Allow for a list of destination directories. Utilize temporary space to its maximum potential by starting a new plot early. Run a maximum number of plots concurrently to avoid bottlenecks or limit resource hogging. More in-depth active plot screen. Installation The installation of this library is straightforward. I […]

Read more