Matplotlib on the tight theme

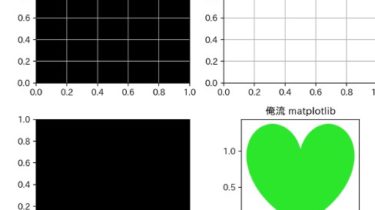
Lazy on demand subplots. 1️⃣ You can add subplots later, wherever you want. 2️⃣ You can manipulate subplots with numpy-like slices. 3️⃣ Oekaki warn about potentially misleading graphs. (ex: No labels or units.) 🍣 (Oekaki imports japanize-matplotlib if it’s installed.) import numpy as np import oekaki # 1️⃣: lazy draw subplots fig = oekaki.figure(strict

Read more

A python package for animating plots build on matplotlib

A python package for making interactive as well as animated plots with matplotlib. Requires Installation or using conda conda install animatplot -c conda-forge Documentation Documentation can be found here Dev Install git clone https://github.com/t-makaro/animatplot.git pip install -e . This project uses pycodestyle for linting. For testing, pytest is used. GitHub https://github.com/t-makaro/animatplot    

Read more

Homework 2: Matplotlib and Data Visualization

Overview These data visualizations were created for my introductory computer science course using Python. I chose to create data visualizations on NBA players because I watched a lot of basketball with my dad growing up. The purpose of this homework assignment was to familiarize ourselves with Matplotlib and CSV files. Five Most Common Ages of NBA Players In this pie chart, I wanted to look into the five most common ages of NBA players. The percentages displayed on the pie […]

Read more

A Python library for plotting hockey rinks with Matplotlib

Hockey Rink A Python library for plotting hockey rinks with Matplotlib. Installation pip install hockey_rink Current Rinks The following shows the custom rinks currently available for plotting. from hockey_rink import NHLRink, IIHFRink, NWHLRink import matplotlib.pyplot as plt fig, axs = plt.subplots(1, 3, sharey=True, figsize=(12, 6), gridspec_kw={“width_ratios”: [1, 98.4/85, 1]}) nhl_rink = NHLRink(rotation=90) iihf_rink = IIHFRink(rotation=90) nwhl_rink = NWHLRink(rotation=90) axs[0] = nhl_rink.draw(ax=axs[0]) axs[1] = iihf_rink.draw(ax=axs[1]) axs[2] = nwhl_rink.draw(ax=axs[2]) The NWHL logo comes from the NWHL site. Customization There is also room […]

Read more

Creates clean and beautiful plots that work on light and dark backgrounds

dufte This package creates clean and beautiful plots that work on light and dark backgrounds. Inspired by the work of Edward Tufte. To use, simply select the dufte style: import dufte import matplotlib.pyplot as plt # global setting: plt.style.use(dufte.style) # with a context manager: with plt.style.context(dufte.style_bar): # … pass Check out dufte.legend(), dufte.ylabel(), and dufte.show_bar_values() for more duftiness. Comparison with default Matplotlib See here for how to create the below plots. matplotlib dufte with dufte.legend() matplotlib dufte dufte with dufte.show_bar_values() […]

Read more

How to Implement a First-Order Low-Pass Filter in Discrete Time

first-order-low-pass-filter This Jupyter notebook shows one way to implement a simple first-order low-pass filter on sampled data in discrete time. We often teach or learn about filters in continuous time, but then need to implement them in discrete time (e.g., in code) on data acquired at discrete sample times. This notebook shows one way to design and implement a simple first-order low-pass filter in discrete time. The example is written in Python and uses Matplotlib. Main File(s) Sample Output Here […]

Read more