A Practical Debugging Tool for Training Deep Neural Networks

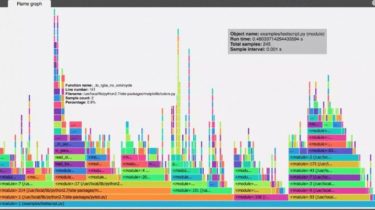
pip install ‘git+https://github.com/f-dangel/cockpit.git’ Cockpit is a visual and statistical debugger specifically designed for deep learning. Training a deep neural network is often a pain! Successfully training such a network usually requires either years of intuition or expensive parameter searches involving lots of trial and error. Traditional debuggers provide only limited help: They can find syntactical errors but not training bugs such as ill-chosen learning rates. Cockpit offers a closer, more meaningful look into the training process with multiple well-chosen instruments. […]

Read more
Python’s missing debug print command and other development tools

Python’s missing debug print command and other development tools. For more information, see documentation. Install Just pip install devtools[pygments] pygments is not required but if it’s installed, output will be highlighted and easier to read. devtools has no other required dependencies except python 3.6, 3.7, or 3.8.If you’ve got python 3.6+ and pip installed, you’re good to go. Usage from devtools import debug whatever = [1, 2, 3] debug(whatever) Outputs: test.py:4 : whatever: [1, 2, 3] (list) That’s only the […]

Read more

Full-screen console debugger for Python

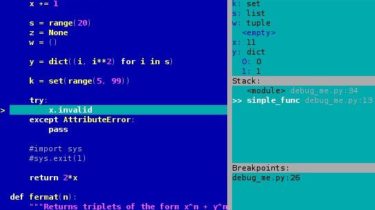
Its goal is to provide all the niceties of modern GUI-based debuggers in a more lightweight and keyboard-friendly package. PuDB allows you to debug code right where you write and test it–in a terminal. If you’ve worked with the excellent (but nowadays ancient) DOS-based Turbo Pascal or C tools, PuDB’s UI might look familiar. Here’s a screenshot: You may watch a screencast, too. Features Syntax-highlighted source, the stack, breakpoints and variables are all visible at once and continuously updated. This […]

Read more

An improbable web debugger through WebSockets

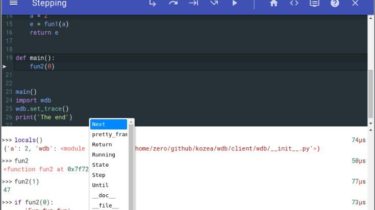
Description wdb is a full featured web debugger based on a client-server architecture. The wdb server which is responsible of managing debugging instances along with browser connections (through websockets) is based on Tornado. The wdb clients allow step by step debugging, in-program python code execution, code edition (based on CodeMirror) setting breakpoints… Due to this architecture, all of this is fully compatible with multithread and multiprocess programs. wdb works with python 2 (2.6, 2.7), python 3 (3.2, 3.3, 3.4, 3.5) […]

Read more

Debugger capable of attaching to and injecting code into python processes

DISCLAIMER: This is not an official google project, this is just something I wrote while at Google. What this is Pyringe is a python debugger capable of attaching to running processes, inspecting their state and even of injecting python code into them while they’re running. With pyringe, you can list threads, get tracebacks, inspect locals/globals/builtins of running functions, all without having to prepare your program for it. What this is not A “Google project”. It’s my internship project that got […]

Read more

A toolbar overlay for debugging Flask applications

This is a port of the excellent django-debug-toolbar for Flask applications. Installation Installing is simple with pip: $ pip install flask-debugtoolbar Usage Setting up the debug toolbar is simple: from flask import Flask from flask_debugtoolbar import DebugToolbarExtension app = Flask(__name__) # the toolbar is only enabled in debug mode: app.debug = True # set a ‘SECRET_KEY’ to enable the Flask session cookies app.config[‘SECRET_KEY’] = ” toolbar = DebugToolbarExtension(app) The toolbar will automatically be injected into Jinja templates when debug mode […]

Read more

A pure-Python library for parsing and analyzing ELF files and DWARF debugging information

pyelftools is a pure-Python library for parsing and analyzing ELF files and DWARF debugging information. See the User’s guide for more details. Pre-requisites As a user of pyelftools, one only needs Python to run. It works with Python versions 2.7 and 3.x (x >= 5). For hacking on pyelftools the requirements are a bit more strict, please see the hacking guide. Installing pyelftools can be installed from PyPI (Python package index): > pip install pyelftools Alternatively, you can download the […]

Read more

IceCream: Never use print() to debug again

IceCream — Never use print() to debug again Do you ever use print() or log() to debug your code? Of course you do. IceCream, or ic for short, makes print debugging a little sweeter. IceCream is well tested, permissively licensed, and supports Python 2, Python 3, PyPy2, and PyPy3. Inspect Variables Have you ever printed variables or expressions to debug your program? If you’ve ever typed something like or the more thorough print(“foo(‘123’)”, foo(‘123’)) then ic() is here to help. […]

Read more

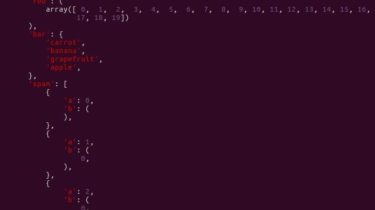
Generate more helpful exception messages for numpy/pytorch matrix algebra expressions

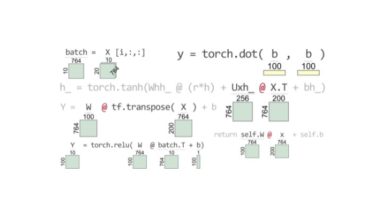
See article Clarifying exceptions and visualizing tensor operations in deep learning code and TensorSensor implementation slides (PDF). One of the biggest challenges when writing code to implement deep learning networks, particularly for us newbies, is getting all of the tensor (matrix and vector) dimensions to line up properly. It’s really easy to lose track of tensor dimensionality in complicated expressions involving multiple tensors and tensor operations. Even when just feeding data into predefined Tensorflow network layers, we still need to […]

Read more

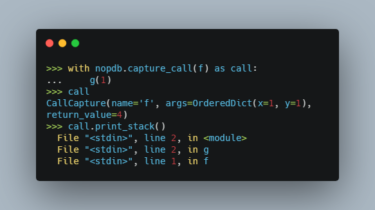
NoPdb: Non-interactive Python Debugger

NoPdb is a programmatic (non-interactive) debugger for Python. This means it gives you access to debugger-like superpowers directly from your code. With NoPdb, you can: capture function calls, including arguments, local variables, return values and stack traces set “breakpoints” that trigger user-defined actions when hit, namely: evaluate expressions to retrieve their values later execute arbitrary code, including modifying local variables enter an interactive debugger like pdb NoPdb is also a convenient tool for inspecting machine learning model internals. For example, […]

Read more