A Python Framework for Modeling and Analysis of Signaling Systems

BioMASS Mathematical modeling is a powerful method for the analysis of complex biological systems. Although there are many researches devoted on producing models to describe dynamical cellular signaling systems, most of these models are limited and do not cover multiple pathways. Therefore, there is a challenge to combine these models to enable understanding at a larger scale. Nevertheless, larger network means that it gets more difficult to estimate parameters to reproduce dynamic experimental data needed for deeper understanding of a […]

Read more
A fine-grained manually annotated named entity recognition dataset

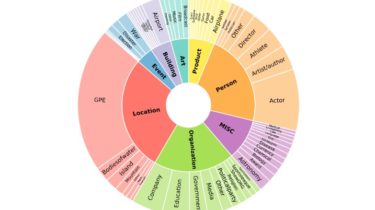
Few-NERD Few-NERD is a large-scale, fine-grained manually annotated named entity recognition dataset, which contains 8 coarse-grained types, 66 fine-grained types, 188,200 sentences, 491,711 entities and 4,601,223 tokens. Three benchmark tasks are built, one is supervised: Few-NERD (SUP) and the other two are few-shot: Few-NERD (INTRA) and Few-NERD (INTER). The schema of Few-NERD is: Few-NERD is manually annotated based on the context, for example, in the sentence “London is the fifth album by the British rock band…“, the named entity London […]

Read more

An implementation of the SPEDAS framework in python

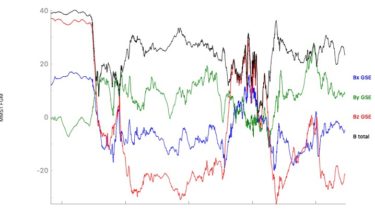
pySPEDAS pySPEDAS is an implementation of the SPEDAS framework in python. The Space Physics Environment Data Analysis Software (SPEDAS) framework is written in IDL and contains data loading, data analysis and data plotting tools for various scientific missions (NASA, NOAA, etc.) and ground magnetometers. Requirements Python 3.7+ is required. We recommend Anaconda which comes with a suite of packages useful for scientific data analysis. Installation pySPEDAS supports Windows, macOS and Linux. To get started, install the pyspedas package using PyPI: […]

Read more

Program for analyzing shadows from Cassini images

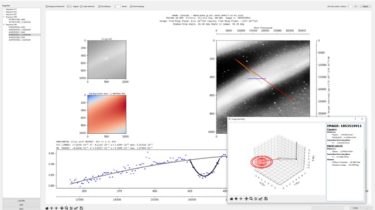
Ring moons of Saturn This packages/program was created for my bachelor’s thesis for the Astronomy department at University of Oulu, Finland It consists of a reader for Vicar Image files and a viewer for analyzing images. The purpose is to extract shadow data from the images and analyze shadow contrast. Info Needs Cassini mission kernels to provide mission data Not here since uncompressed 37Gb or compressed 16Gb Uses NASA NAIF Spice which is used throughSpiceyPy wrapper Parses VICAR2 file format. […]

Read more

A python package for analyzing and visualizing volumetric data

The yt Project yt is an open-source, permissively-licensed python package for analyzing and visualizing volumetric data. yt supports structured, variable-resolution meshes, unstructured meshes, and discrete or sampled data such as particles. Focused on driving physically-meaningful inquiry, yt has been applied in domains such as astrophysics, seismology, nuclear engineering, molecular dynamics, and oceanography. Composed of a friendly community of users and developers, we want to make it easy to use and develop – we’d love it if you got involved! We’ve […]

Read more

A scikit-learn-compatible module for estimating prediction intervals

MAPIE MAPIE allows you to easily estimate prediction intervals on single-output data using your favourite scikit-learn-compatible regressor. Prediction intervals output by MAPIE encompass both aleatoric and epistemic uncertainty and are backed by strong theoretical guarantees [1]. Requirements Python 3.7+ MAPIE stands on the shoulders of giant. Its only internal dependency is scikit-learn. Installation Install via pip: pip install mapie To install directly from the github repository : pip install git+https://github.com/simai-ml/MAPIE Quickstart Let us start with a basic regression problem. Here, […]

Read more

Visualization and diagnostics for cluster analysis in Python

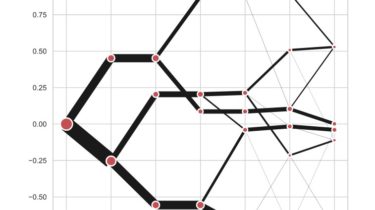
Clustergram The clustergram was later implemented in R by Tal Galili, who also gives a thorough explanation of the concept. This is a Python translation of Tal’s script written for scikit-learn and RAPIDS cuML implementations of K-Means, Mini Batch K-Means and Gaussian Mixture Model (scikit-learn only) clustering, plus hierarchical/agglomerative clustering using SciPy. Alternatively, you can create clustergram using from_* constructors based on alternative clustering algorithms. Getting started You can install clustergram from conda or pip: conda install clustergram -c conda-forge […]

Read more

Self-Supervised Contrastive Learning of Music Spectrograms

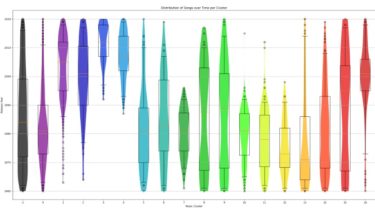
Self-Supervised Music Analysis Self-Supervised Contrastive Learning of Music Spectrograms. Dataset Songs on the Billboard Year End Hot 100 were collected from the years 1960-2020. This list tracks the top songs of the US market for a given calendar year based on aggregating metrics including streaming plays, physical and digital purchases, radio plays, etc. In total the dataset includes 5737 songs, excluding some songs which could not be found and some which are duplicates across multiple years. It’s worth noting that […]

Read more

Histogramming for analysis powered by boost-histogram

Hist Hist is a analyst friendly front-end for boost-histogram, designed for Python 3.7+ (3.6 users get version 2.3). Installation You can install this library from PyPI with pip: python3 -m pip install “hist[plot]” If you do not need the plotting features, you can skip the [plot] extra. Features Hist currently provides everything boost-histogram provides, and the following enhancements: Hist augments axes with names: name= is a unique label describing each axis label= is an optional string that is used in […]

Read more

An open-source Python library for the analysis of network-based spatial data

spaghetti Spaghetti is an open-source Python library for the analysis of network-based spatial data. Originating from the network module in PySAL (Python Spatial Analysis Library), it is under active development for the inclusion of newly proposed methods for building graph-theoretic networks and the analysis of network events. An example of a network’s minimum spanning tree: Examples The following are a selection of some examples that can be launched individually as interactive binders from the links on their respective pages. Additional […]

Read more
1 2 3