A Gentle Introduction to Statistical Data Distributions

Last Updated on August 8, 2019
A sample of data will form a distribution, and by far the most well-known distribution is the Gaussian distribution, often called the Normal distribution.
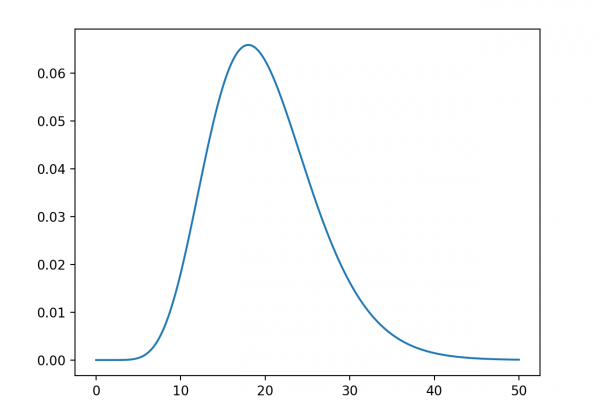
The distribution provides a parameterized mathematical function that can be used to calculate the probability for any individual observation from the sample space. This distribution describes the grouping or the density of the observations, called the probability density function. We can also calculate the likelihood of an observation having a value equal to or lesser than a given value. A summary of these relationships between observations is called a cumulative density function.
In this tutorial, you will discover the Gaussian and related distribution functions and how to calculate probability and cumulative density functions for each.
After completing this tutorial, you will know:
- A gentle introduction to standard distributions to summarize the relationship of observations.
- How to calculate and plot probability and density functions for the Gaussian distribution.
- The Student t and Chi-squared distributions related to the Gaussian distribution.
Kick-start your project with my new book Statistics for Machine Learning, including step-by-step tutorials and the Python source code files for all examples.
Let’s get started.