A Gentle Introduction to Autocorrelation and Partial Autocorrelation
Last Updated on August 14, 2020
Autocorrelation and partial autocorrelation plots are heavily used in time series analysis and forecasting.
These are plots that graphically summarize the strength of a relationship with an observation in a time series with observations at prior time steps. The difference between autocorrelation and partial autocorrelation can be difficult and confusing for beginners to time series forecasting.
In this tutorial, you will discover how to calculate and plot autocorrelation and partial correlation plots with Python.
After completing this tutorial, you will know:
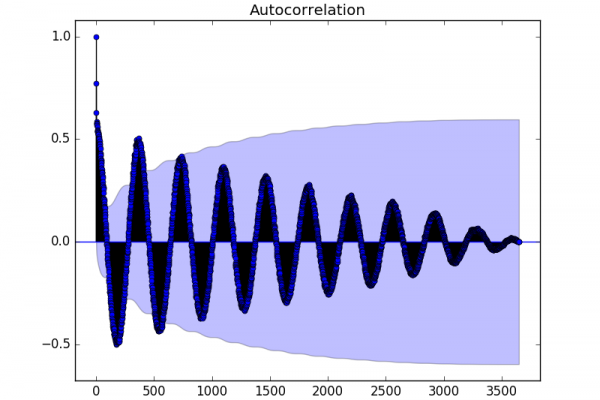
- How to plot and review the autocorrelation function for a time series.
- How to plot and review the partial autocorrelation function for a time series.
- The difference between autocorrelation and partial autocorrelation functions for time series analysis.
Kick-start your project with my new book Time Series Forecasting With Python, including step-by-step tutorials and the Python source code files for all examples.
Let’s get started.
- Updated Apr/2019: Updated the link to dataset.
Minimum Daily Temperatures Dataset
This dataset describes the minimum daily temperatures over 10 years (1981-1990) in the city Melbourne, Australia.
The units are in degrees Celsius and there are 3,650 observations. The source of the data is credited as
To finish reading, please visit source site