Matplotlib Violin Plot – Tutorial and Examples

Introduction There are many data visualization libraries in Python, yet Matplotlib is the most popular library out of all of them. Matplotlib’s popularity is due to its reliability and utility – it’s able to create both simple and complex plots with little code. You can also customize the plots in a variety of ways. In this tutorial, we’ll cover how to plot Violin Plots in Matplotlib. Violin plots are used to visualize data distributions, displaying the range, median, and distribution […]

Read more

When is programming needed in most leading Self Service configurations

To all Data Analysts big and small: Many Corporates typically have Self service BI and DWH solutions ( I am asking only about those who did NOT build an inhouse solution) :  -When is programming needed in most leading Self Service configurations? -When do analysts and Business executives require coding and programming when the Self service application, slice and dice, filtering and fields are not enough?! – IN SOME PLACES, us junior analysts are getting a feeling (that may be […]

Read more

Reading and Writing XML Files in Python with Pandas

Introduction XML (Extensible Markup Language) is a markup language used to store structured data. The Pandas data analysis library provides functions to read/write data for most of the file types. For example, it includes read_csv() and to_csv() for interacting with CSV files. However, Pandas does not include any methods to read and write XML files. In this article, we will take a look at how we can use other modules to read data from an XML file, and load it […]

Read more

How to Change Plot Background in Matplotlib

Introduction Matplotlib is one of the most widely used data visualization libraries in Python. From simple to complex visualizations, it’s the go-to library for most. In this tutorial, we’ll take a look at how to change the background of a plot in Matplotlib. Importing Data and Libraries Let’s import the required libraries first. We’ll obviously need Matplotlib, and we’ll use Pandas to read the data: import matplotlib.pyplot as plt import pandas as pd Specifically, we’ll be using the Seattle Weather […]

Read more

How to Iterate over Rows in a Pandas DataFrame

Introduction Pandas is an immensely popular data manipulation framework for Python. In a lot of cases, you might want to iterate over data – either to print it out, or perform some operations on it. In this tutorial, we’ll take a look at how to iterate over rows in a Pandas DataFrame. If you’re new to Pandas, you can read our beginner’s tutorial. Once you’re familiar, let’s look at the three main ways to iterate over DataFrame: items() iterrows() itertuples() […]

Read more

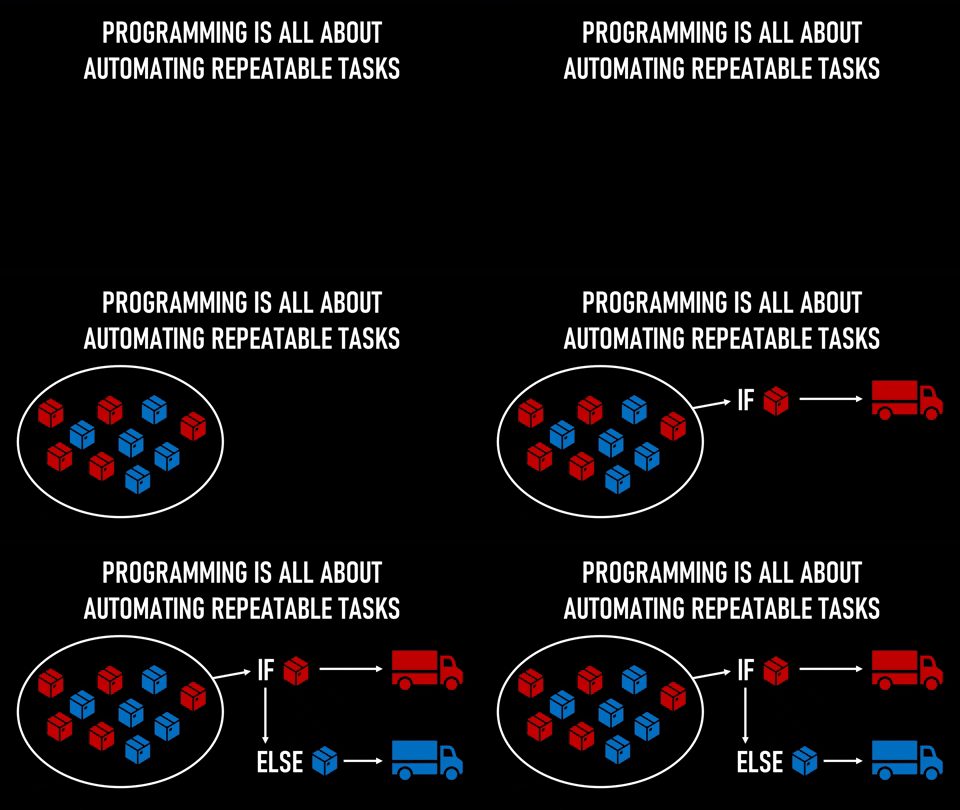
Visually Explained: How Can Executives Grasp What Programming Is All About?

Quite often, non-technical executives have difficulties understanding what programming, on a very fundamental level, is all about. Because of that knowledge-gap, they tend to hire and overburden experienced data professionals with tasks which they are hopelessly overqualified for. Such as, for example, doing ad-hoc SQL queries on CRM data: “You’re the go-to-guy for all things data, and we need the results for the board meeting tomorrow.” That’s a quite humbling and frustrating experience for anyone who calls himself a Data […]

Read more

Python with Pandas: DataFrame Tutorial with Examples

Introduction Pandas is an open-source Python library for data analysis. It is designed for efficient and intuitive handling and processing of structured data. The two main data structures in Pandas are Series and DataFrame. Series are essentially one-dimensional labeled arrays of any type of data, while DataFrames are two-dimensional, with potentially heterogenous data types, labeled arrays of any type of data. Heterogenous means that not all “rows” need to be of equal size. In this article we will go through […]

Read more

Pandas Library for Data Visualization in Python

In my previous article, I explained how the Seaborn Library can be used for advanced data visualization in Python. Seaborn is an excellent library and I always prefer to work with it, however, it is a bit of an advanced library and needs a bit of time and practice to get used to. In this article, we will see how Pandas, which is another very useful Python library, can be used for data visualization in Python. Pandas is primarily used […]

Read more

Analysis of Black Friday Shopping Trends via Machine Learning

Introduction Wikipedia defines Black Friday as an informal name for the Friday following Thanksgiving Day in the United States, which is celebrated on the fourth Thursday of November. [Black Friday is] regarded as the beginning of America’s Christmas shopping season […]. In this article, we will try to explore different trends from the Black Friday shopping dataset. We will extract useful information that will answer questions such as: what gender shops more on Black Friday? Do the occupations of the […]

Read more

Dimensionality Reduction in Python with Scikit-Learn

Introduction In machine learning, the performance of a model only benefits from more features up until a certain point. The more features are fed into a model, the more the dimensionality of the data increases. As the dimensionality increases, overfitting becomes more likely. There are multiple techniques that can be used to fight overfitting, but dimensionality reduction is one of the most effective techniques. Dimensionality reduction selects the most important components of the feature space, preserving them and dropping the […]

Read more
1 2 3