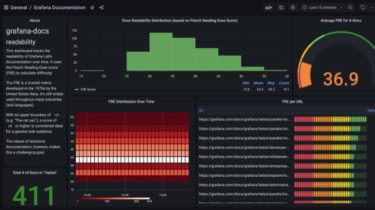
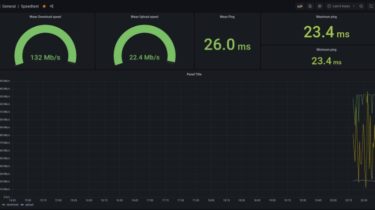
A small project that allows internet speed monitoring using Grafana and Speedtest

Speedtest monitor for Grafana A small project that allows internet speed monitoring using Grafana, InfluxDB 2 and Speedtest. Requirements Docker and Docker compose. Python 3.+ (3.9.5 is recommended) Virtualenv pip install virtualenv Setup With Docker Make sure Docker and Docker-compose are installed before running the following commnad $ docker-compose build $ docker-compose up For development First make sure InfluxDB is up and running $ docker-compose up influxdb Once that is done you may setup your development environment. Make sure Python […]

Read more

Datapane makes it simple to build shareable reports from Python

datapane Turn a Python analysis into a beautiful document in 3 lines of code.Datapane is a Python library which makes it simple to build reports from the common objects in your data analysis, such as pandas DataFrames, plots from Python visualisation libraries, and Markdown. Reports can be exported as standalone HTML documents, with rich components which allow data to be explored and visualisations to be used interactively. You can also publish reports to our free public community platform or share […]

Read more

A Prometheus exporter for monitoring & analyzing Grafana Labs’ technical documentation

grafana-docs-exporter A Prometheus exporter for monitoring & analyzing Grafana Labs’ technical documentation This exporter uses git to pull the newest versions of Grafana’s docs from the official repo. It then programmatically builds all the URLs to scrape those pages, just like Hugo does when it builds the actual docs website. These URLs are then scraped, parsed, analyzed, and exposed in Prometheus format. To add these metrics to your own Prometheus instance, just add this job to your prometheus.yml: – job_name: […]

Read more

Splunk modular input plugin to fetch the enterprise audit log from GitHub Enterprise

GitHub Enterprise Audit Log Monitoring Splunk modular input plugin to fetch the enterprise audit log from GitHub Enterprise Support for modular inputs in Splunk Enterprise 5.0 and later enables you to add new types of inputs to Splunk Enterprise that are treated as native Splunk Enterprise inputs. This modular input makes an HTTPS request to the GitHub Enterprise’s Audit Log REST API endpoint at a definable interval to fetch audit log data. Prerequisites Splunk Heavy Forwarder v8.0+ Python 3.7+ GitHub […]

Read more

Real-time Coastal Monitoring at the University of Hawaii at Manoa

Coastal Monitoring at the University of Manoa Source code for Beaglebone/RPi-based data loggers, shore internet gateways, and web server. Software developed for the Coastal Environment Monitoring project at the University of Hawaii at Manoa. Project website: https://grogdata.soest.hawaii.edu/project_info/ I’m using this mostly for synchronizing the software and configurations on our gateways, loggers, and servers; I’m not using this to track issues or updates. More like “Dropbox for source code” than “git for source control”. That said, the drivers/ folder does contain […]

Read more

A python module for monitoring memory consumption

Memory Profiler This is a python module for monitoring memory consumption of a process as well as line-by-line analysis of memory consumption for python programs. It is a pure python module which depends on the psutil module. Installation Install via pip: $ pip install -U memory_profiler The package is also available on conda-forge. To install from source, download the package, extract and type: $ python setup.py install Usage line-by-line memory usage The line-by-line memory usage mode is used much in […]

Read more
1 2