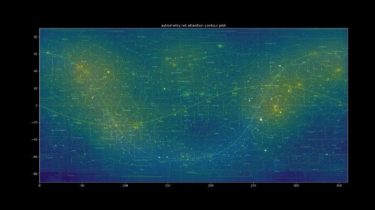
Sky attention heatmap of submissions to astrometry.net


Installation
Requires Python 3.6+, Tested with Python 3.9.5
Install library dependencies
pip install -r requirements.txt
The program requires the following .csv file to be extracted into this folder:
http://broiler.astrometry.net/~dstn/temp/wcs.csv.gz
Usage
python main.py
The plot is saved to the current directory as .png and shown in a matplotlib window.
GitHub