How to Visualize Gradient Boosting Decision Trees With XGBoost in Python
Last Updated on August 27, 2020
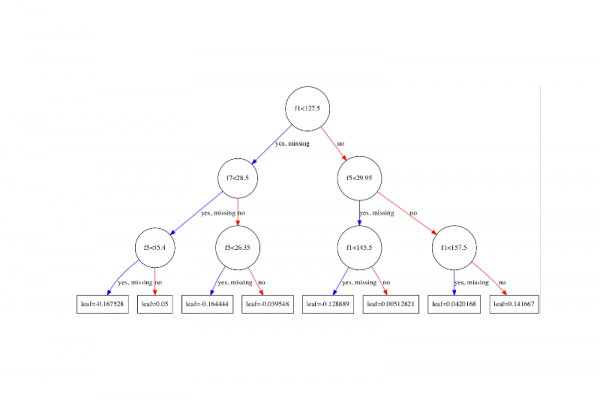
Plotting individual decision trees can provide insight into the gradient boosting process for a given dataset.
In this tutorial you will discover how you can plot individual decision trees from a trained gradient boosting model using XGBoost in Python.
Kick-start your project with my new book XGBoost With Python, including step-by-step tutorials and the Python source code files for all examples.
Let’s get started.
- Update Mar/2018: Added alternate link to download the dataset as the original appears to have been taken down.

How to Visualize Gradient Boosting Decision Trees With XGBoost in Python
Photo by Kaarina Dillabough, some rights reserved.
Need help with XGBoost in Python?
Take my free 7-day email course and discover xgboost (with sample code).
Click to sign-up now and also get a free PDF Ebook version of the course.
Plot a Single XGBoost Decision Tree
The XGBoost Python API provides a
To finish reading, please visit source site