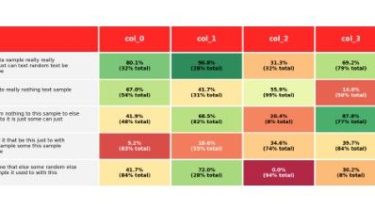
Create a table with row explanations, column headers, using matplotlib
Create a table with row explanations, column headers, using matplotlib. Intended usage was a small table containing a custom heatmap. Installation pip install mpl-table Usage Example usage can be found within tests/test_create_table.py, the table is created by passing dataframes containing text values, cell colour values, and text colour values. You’ll probably want to use bbox_inches=”tight” when you fig.savefig. Example output Why Wanted to be able to create tables containing heatmaps, along with row explanations and different treatment of high/low values […]
Read more