How to Load and Explore Time Series Data in Python
Last Updated on April 30, 2020
The Pandas library in Python provides excellent, built-in support for time series data.
Once loaded, Pandas also provides tools to explore and better understand your dataset.
In this post, you will discover how to load and explore your time series dataset.
After completing this tutorial, you will know:
- How to load your time series dataset from a CSV file using Pandas.
- How to peek at the loaded data and calculate summary statistics.
- How to plot and review your time series data.
Kick-start your project with my new book Time Series Forecasting With Python, including step-by-step tutorials and the Python source code files for all examples.
Let’s get started.
- Updated Apr/2019: Updated the link to dataset.
- Update Aug/2019: Updated data loading to use new API.
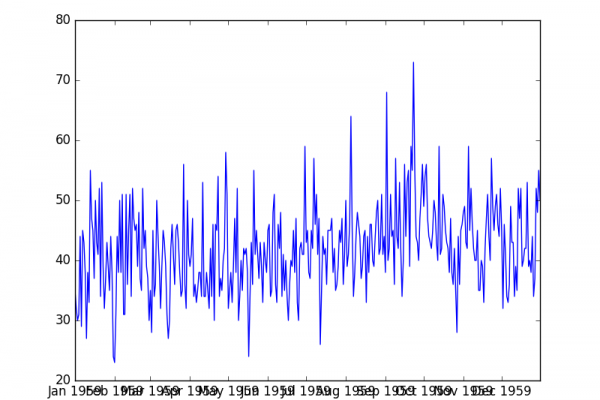
Daily Female Births Dataset
In this post, we will use the Daily Female Births Dataset as an example.
This univariate time series dataset describes the number of daily female births in California in 1959.
The units are a count and there are 365 observations. The source of the dataset is credited to Newton (1988).
Below is a sample of the first 5 rows of data, including
To finish reading, please visit source site